On the Records: Mapping Texas Education
/https://static.texastribune.org/media/images/econ_disadvantaged_schools.jpg)
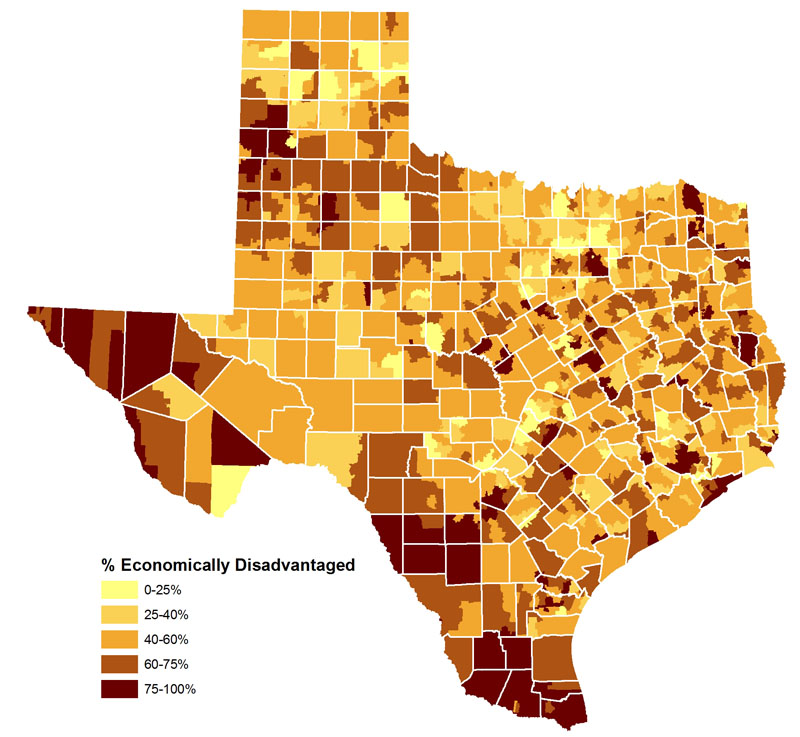
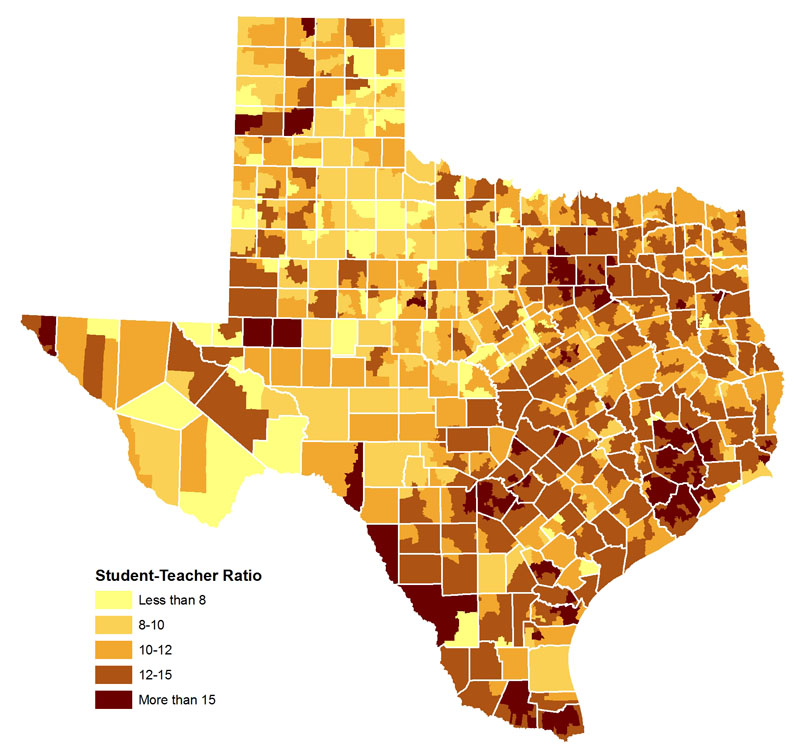
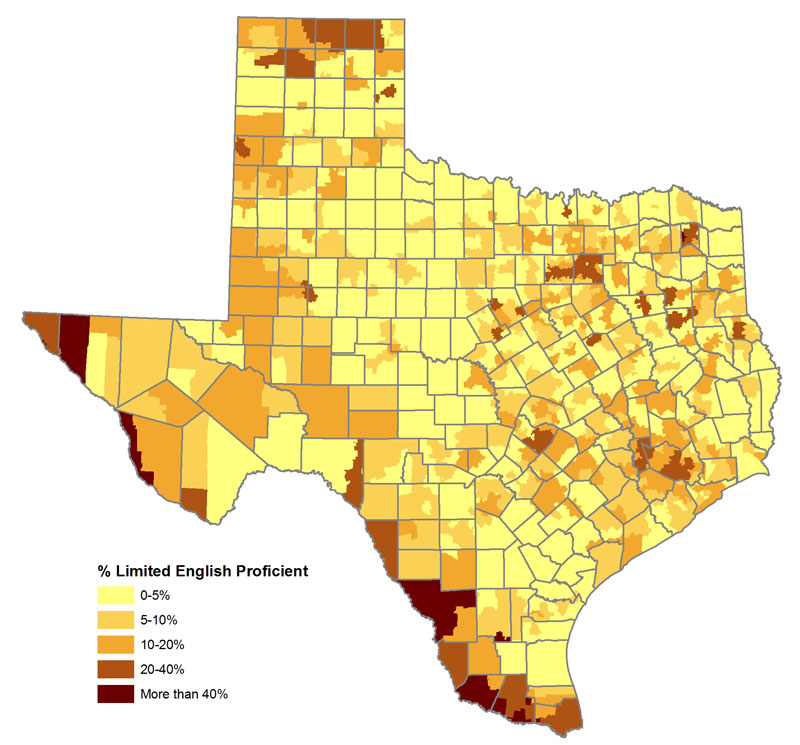
Among the education data collected by Houston nonprofit Children at Risk is a snapshot of each district's demographics and academic performance during the 2008-09 school year.
You can view campus-specific information in our database, but we've also sought to visualize the data at the district level using mapping software.
Here's a district-by-district look at the percentage of students who are "economically disadvantaged," as defined by the state:
Here's a map of districts by their student-to-teacher ratios:
And, finally, here's a look at districts by the percentage of students defined as having limited English proficiency:
Ideas for other maps? Let us know.
Texas Tribune donors or members may be quoted or mentioned in our stories, or may be the subject of them. For a complete list of contributors, click here.
Information about the authors
Learn about The Texas Tribune’s policies, including our partnership with The Trust Project to increase transparency in news.


/https://static.texastribune.org/media/profiles/TxTrib-Staff_0016_StilesMatt800.jpg)