On the Records: Lottery Maps, Part II
/https://static.texastribune.org/media/images/lottery-sales.JPG)
Last week we noted a series by the Austin American-Statesman about the state of the Texas Lottery, which has evolved over time from a Lotto-centric business to one that now relies heavily on instant scratch-off tickets for revenue. The series also explored the fact that lower-income and poorly educated people are more likely to play.
To illustrate this latter fact, we mapped lottery sales by ZIP code and per-capita income levels. The illustration showed that sales were indeed higher in poorer areas.
We wondered, though, about the first story and the breakdown of sales by the type of lottery game. (Download the data compiled by the Statesman, which also published a searchable database of retailers).
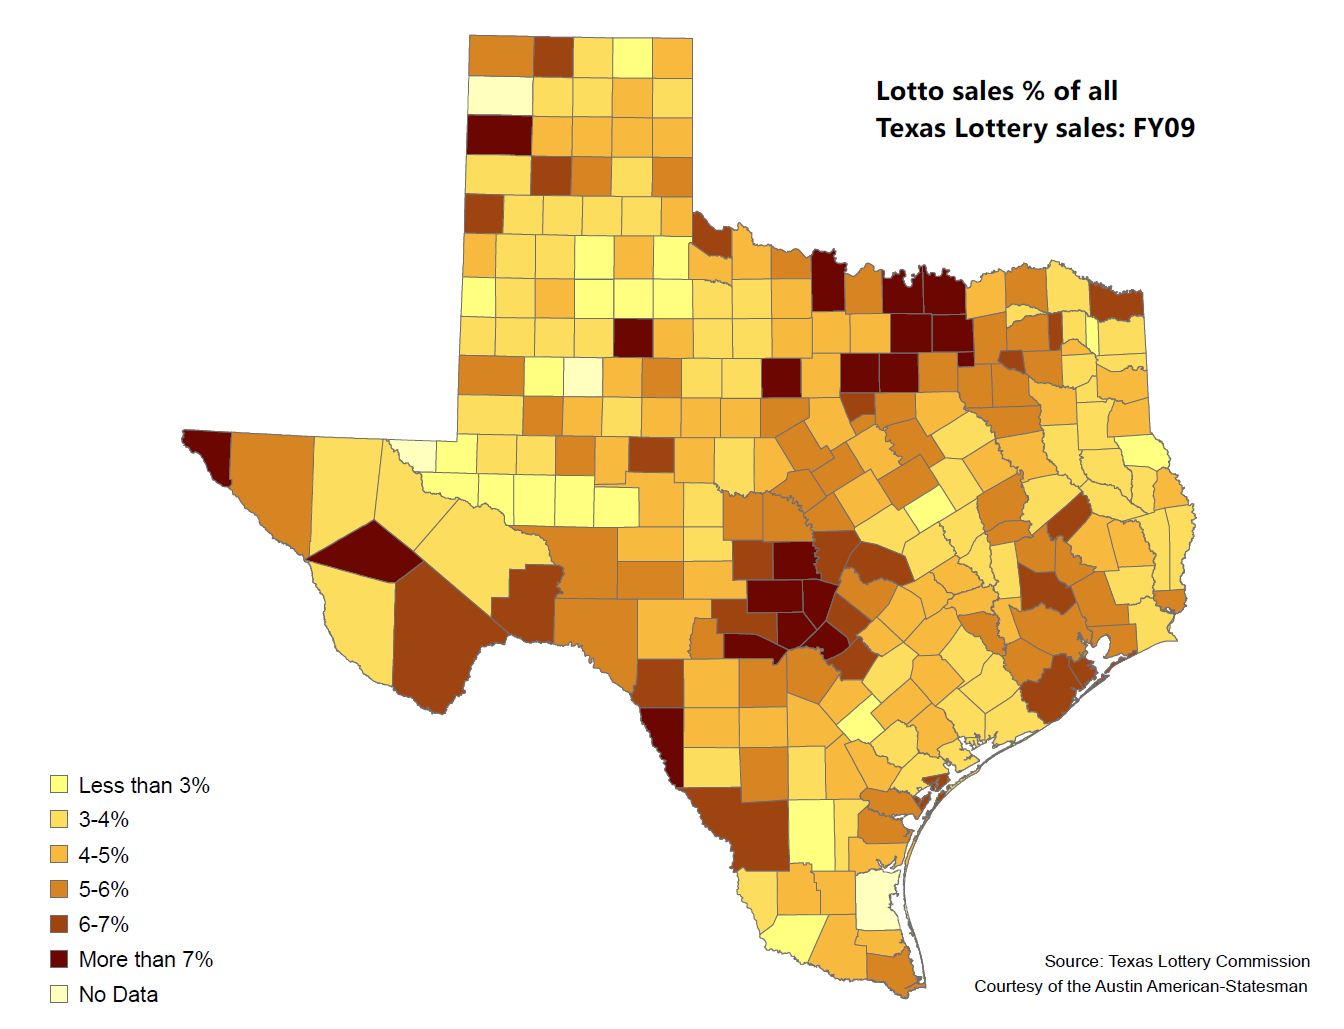
Geography isn't always the best method for visualizing data, but it can illustrate trends. This map shows that a higher proportion of lottery revenue last year in Hill County counties came from Lotto sales:
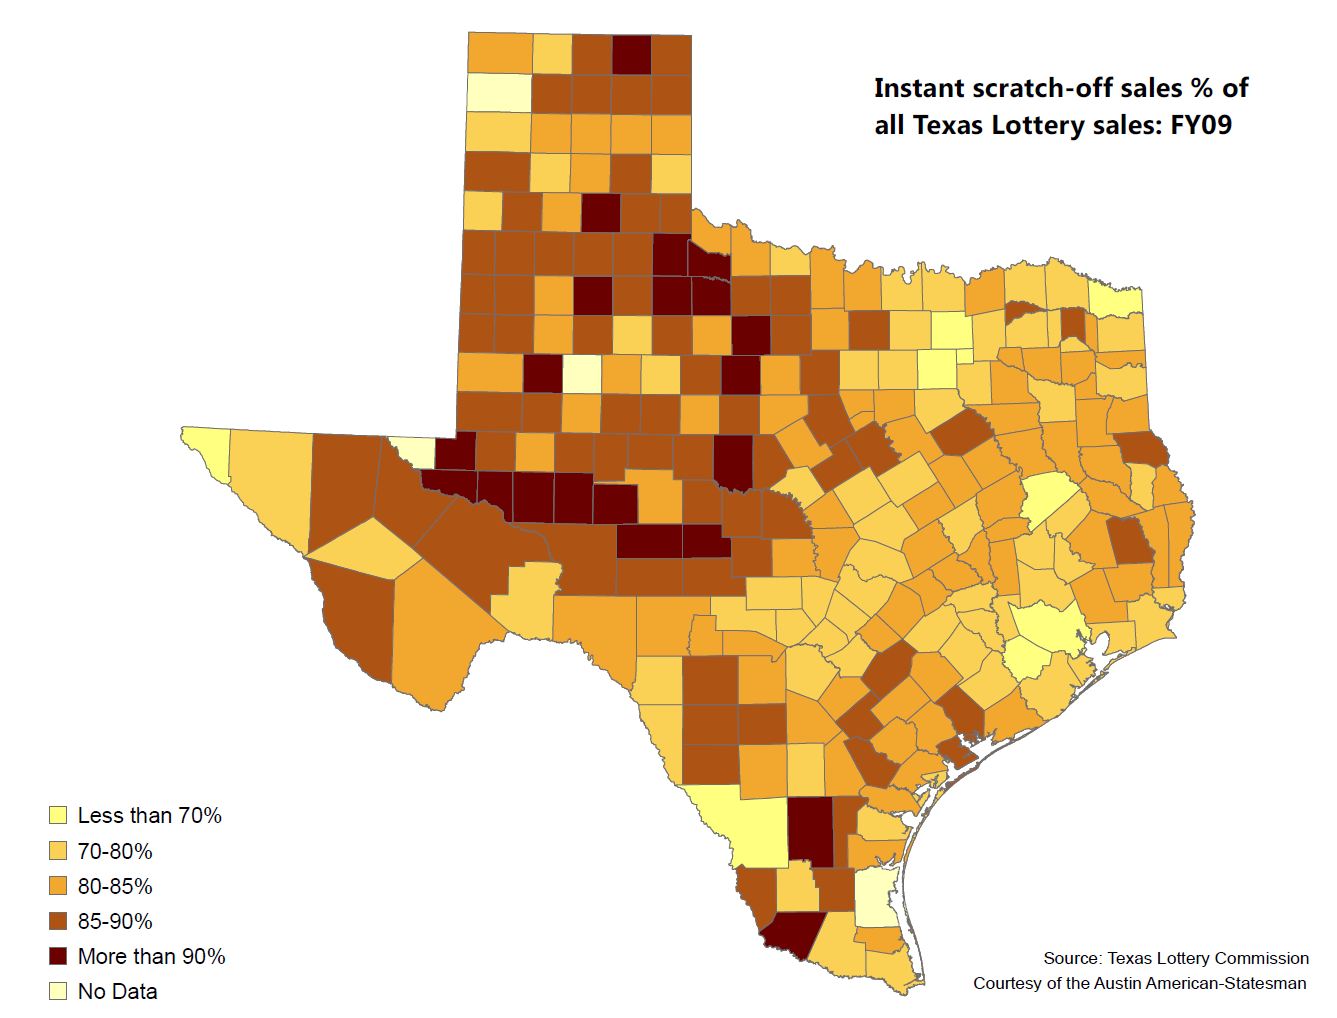
Many counties in West Texas, meanwhile, appear to prefer instant scratch-off tickets:
We'd love to hear your ideas about why that's the case, but it could have to do with age, income levels or educational attainment (or lottery marketing) differences in the two areas.
Let us know if you have ideas for maps or other visualizations — and be sure to follow @TribData on Twitter for updates.
Texas Tribune donors or members may be quoted or mentioned in our stories, or may be the subject of them. For a complete list of contributors, click here.
Information about the authors
Learn about The Texas Tribune’s policies, including our partnership with The Trust Project to increase transparency in news.


/https://static.texastribune.org/media/profiles/TxTrib-Staff_0016_StilesMatt800.jpg)